 Research Article
Analysis of the Dynamics of Ontogenesis of Birch Leaves (Betula Pendula) Under Environmentally Friendly Conditions
P M Mazurkin1*, A I Kudryashova2
1Peter Matveevich Mazurkin, Dr. tech. sciences, prof., Volga State University of Technology, 424000, Russia, the Republic of Mari El, Yoshkar-Ola, Lenin Sq., b. 3., SPIN: 3355-8099; Researcher ID: H-7464-2014; Orcid ID: 0000-0003-0177-5521
2Anastasia Igorevna Kudryashova, S. lec., Volga State University of Technology, Yoshkar-Ola, Russia, SPIN: 6157-2253.
P M Mazurkin, 1Peter Matveevich Mazurkin, Dr. tech. sciences, prof., Volga State University of Technology, 424000, Russia, the Republic of Mari El, Yoshkar-Ola, Lenin Sq., b. 3., SPIN: 3355-8099; Researcher ID: H-7464-2014; Orcid ID: 0000-0003-0177-5521
Received Date:May 01, 2023; Published Date:June 19, 2023
Abstract
The method of rank distribution of five parameters (ontogenesis period, length, width, perimeter, area) of 20 accounting birch leaves in the dynamics of ontogenesis by 12 measurement dates is presented. Without modeling by ranks, the quality factor of measurements is revealed. By the sum of the ranks, leaflets No. 19 and No. 20 turned out to be the best. They are on the western side of a young birch. By rank, research can also be carried out in schools. Further, factor analysis is carried out in four stages: identification of patterns of rank distribution; rating of rows and columns of the data matrix; identification of patterns and rating of binary relations by the correlation coefficient. By reducing the correlation of the equations of rank distributions, the parameters are located: 1) 1.0000 - the growing season; 2) 0.9999 - the length of the birch record sheet; 3) 0.9999 - width; 4) 0.9941 - perimeter; 5) 0.9890 - area. The rating by rows and columns showed that the vegetation period was in the first place as an indicator. According to the rating, among the influencing variables, the angle of the junction of the branch to the birch trunk was in the first place, the length was in the second, and the width was in the third. As a dependent indicator, the length is in the first place, the width is in the second, and the area is in the third. With waves ranked as influencing variables, length was number one, width was number two, and area was number three. Taking into account wavelets, the angle of junction of the branch to the trunk was only in fourth place. As an indicator, the length is again in the first place, the width is in the second, and the area is in the third place. The coefficient of correlative variation of factor analysis, taking into account wave components, is 0.7365. This is a high indicator of the functional connectivity of the “leaves - branches - trunk - soil” system located in ecologically clean conditions. Of the 40 resgularities, 18 equations (45%) were selected, having a closeness of connection of more than 0.7 with a maximum of growth and development during the growing season according to five biological parameters. The maximum correlation coefficient of 0.9994 is observed for the direct and inverse width-length functions. The influence of length and width on other parameters is characterized by a power function. Above a strong level of adequacy of at least 0.9, 13 (32.5%) equations remained. It is proved that only the width can be used in further experiments.
Keywords:Birch; Leaves; Parameters; Ontogeny; Dynamics; Ratings; Patterns
Introduction
Knowledge of the ecological and biological properties of the components of plant communities is necessary for a more complete understanding of the organization and dynamics of phytocenoses. Long before realizing this position, researchers began to make ob servations on the ecology and biology of individual plant species. The ecological properties of plants have been studied especially extensively in order to use them as indicators of certain environmental conditions [1].
Plant growth is a complex process, it is based on such fundamental phenomena as rhythm, polarity, differentiation, irritability, correlation. All these processes are common to the ontogenesis of all living organisms.
Ontogenesis is the individual development of an organism from a zygote (or vegetative germ) to natural death. Due to the active activity of meristems and photosynthetic activity of leaves, a green plant acquires a number of those peculiar features that characterize its growth. The latter in the process of plant ontogenesis is observed during the main stages of its life cycle.
The stages of ontogenesis are the morphological and functional branching of ontogenesis. They manifest themselves in changes in the nature of growth, differentiation and functional activity of the organism. There are five such stages: embryonic, juvenile, maturity, reproduction and old age. These are not isolated periods of development, but mutually transitioning phases, which are based on slow-moving age-related changes, i.e. changes in the body and its individual parts due to age. Age-related changes in cells, tissues and organs depend on their inherent growth, the general age of the organism, as well as on the nature of relationships with other parts of the plant [2].
A.A. Uranov supplemented and detailed the periodization of the ontogenetic states of plants, elaborated in detail the question of the vitality of individuals in cenopopulations and the theory of the conjugacy of cenopopulations in phytocenoses, the concept of the phytogenic field and the wave development of cenopopulations. He developed the theory of the phytogenic field in the phytocenosis [3].
However, he did not consider the continuity of the dynamics of the parameters of plant leaves during the entire growing season. But even a detailed consideration of shaping without taking into account the growing season does not lead to tangible results. Therefore, we believe that first we need to study the dynamics of ontogenesis, and then only link the formation to dynamic patterns.
The science synthesizing the system of knowledge about the seasonal development of plants is called phenology; the science studying plant communities is phytophenology, and the section studying woody plants is dendrophenology. The formation and death of leaves in the cycle of ontogenesis are divided into the following stages: budding, leaf growth and development, flowering of dying leaves, leaf fall.
Vegetation is a state of plants in which processes of visible growth of vegetative and generative organs occur, and continuous assimilation activity of leaves is carried out. In deciduous species of woody plants, the phenological indicator of the beginning of vegetation is the budding of vegetative buds, and the indicator of the end is leaf fall.
We have previously described methods for measuring the length, width, perimeter and area of the accounting leaves of linden and birch without cutting them in the dynamics of their development and growth during the growing season from the moment of budding of all leaves to the moment of falling of each accounting sheet. Detailed methods of selection of accounting leaves of linden and birch in urban conditions of tree growth for ecological monitoring of the urban environment are given [4].
Without mathematical modeling, the methods of measuring the four parameters and the growing season, as well as determining the rating places of each accounting leaf of the tree can be used in school environmental circles.
Materials And Methods
Highly adequate models with wave components were obtained on the accounting leaves of birch growing in environmentally friendly conditions.
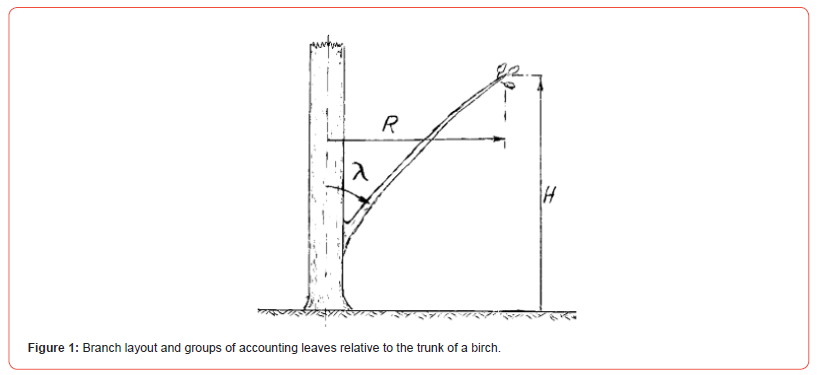
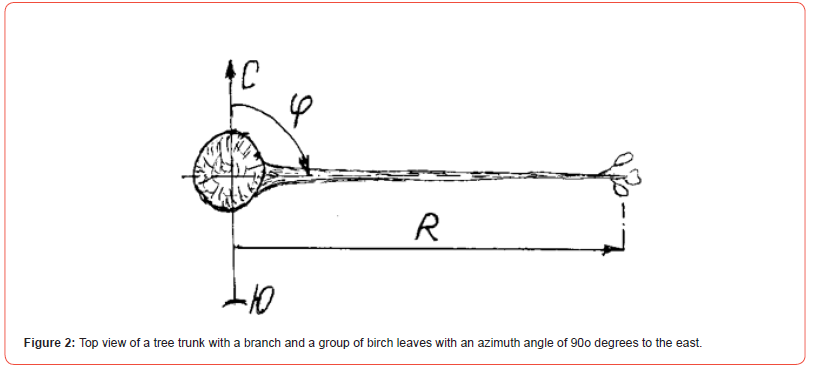
Regularities were obtained showing the influence of groups of accounting leaves located on individual branches, depending on the azimuth, radius of groups of birch leaves from the trunk axis and the angle of the branch to the trunk (Figure 1, Figure 2).
It is proved that air pollution drowns out the mechanism of vibrational adaptation of leaves of woody plants in the process of annual (seasonal) ontogenesis.
Relative to each branch, the measured azimuth of the direction of the branch ϕ , the angle of the branch to the trunk of the tree λ , the radius of the location of the group of leaves on each branch R and the height H of this group of accounting leaves from the soil surface.
Experiments on the tree were carried out in the city of Yoshkar- Ola (Figure 3) during the growing season on the same 20 registered birch leaves (Figure 4), located on the side of Osipenko Street near the Botanical Garden and secondary school No. 2 in Yoshkar-Ola.

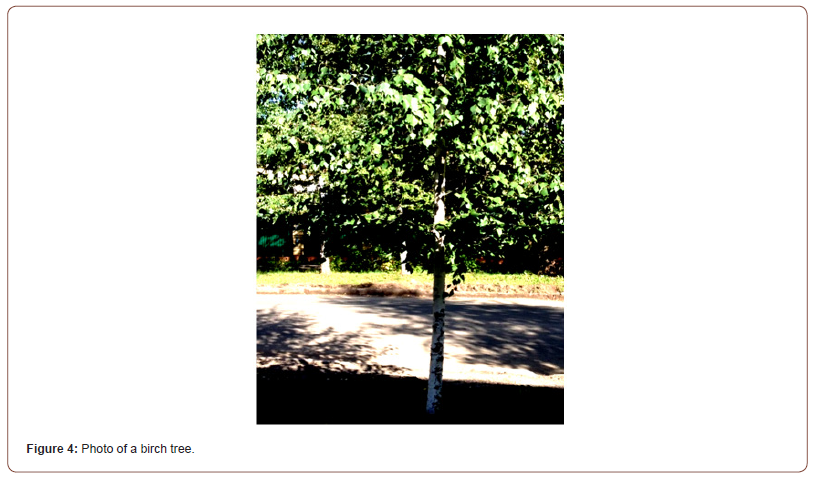
Table 1 shows the results of measurements in ontogenesis, from the moment of budding to the moment of the fall of each birch leaf in ontogenesis in pure environmental conditions. For the beginning of the growing season, it was accepted on May 2, provided. Until October 1, that is, the date of the fall of the last accounting sheet of birch, 12 measurements were carried out on each birch leaf, therefore, only 240 rows of initial data were obtained on 20 birch leaves in Table 1.
Table 1 gives the symbols for the parameters of the birch leaf:
Table 1:Initial data on the dynamics of parameters in 20 accounting birch leaves in ontogenesis under pure environmental conditions during the growing season.
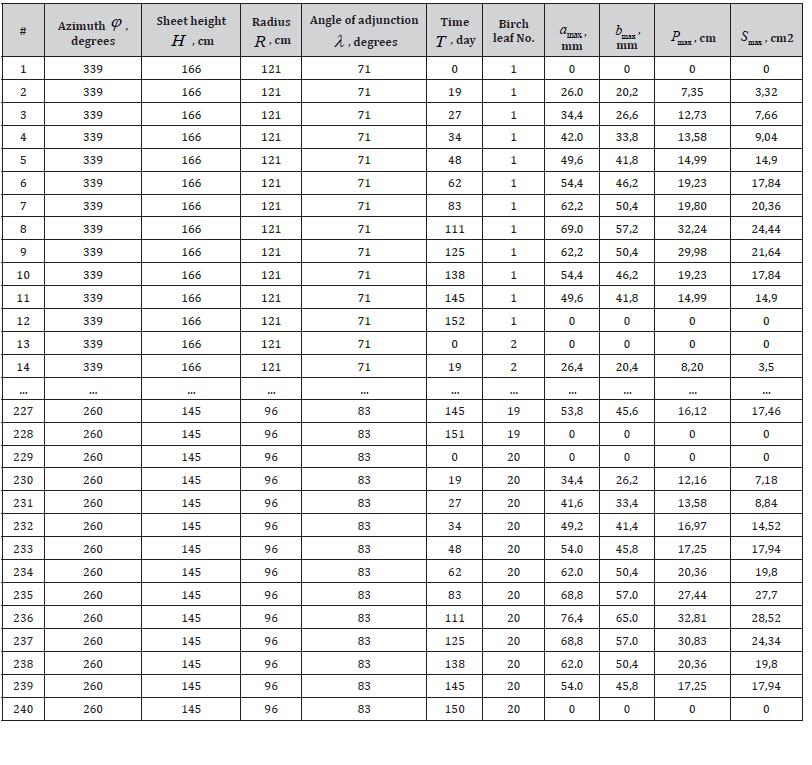
a – the length of the leaf along the main vein, measured from
the junction of the petiole with the leaf plate to the end of the leaf
tip, mm;
b – the width of the sheet at the extreme points across the
sheet plate or the total width of the sheet in the largest cross-section
of the sheet, mm;
P – perimeter of the sheet, cm;
S – the area of the sheet measured by the number of cells 2×
2 mm and the number of incomplete cells of the perimeter of the
sheet, cm2.
The perimeter and area of the accounting sheet are calculated using the formulas:

where IS – the number of cells 2× 2 mm inside the contour of the accounting sheet of birch, pcs., IÐ – the number of halves of cells located along the perimeter of the birch accounting sheet, pcs.
These initial data on the number of two-millimeter cells of the pallet are necessary for statistical data modeling by the identification method [6, 7] and plotting the dynamics of the four main parameters of accounting birch leaves growing in clean environmental conditions, and subsequent analysis of statistical models of the dynamics of ontogenesis.
Results And Discussion
Regularities of dynamics of parameters of birch leaves
Statistical modeling for the entire sample of Table 1 identifies patterns in the form of structural models of the dynamics of ontogenesis a = f (t) , b = f (t) , P = f (t) and S = f (t) , which have two zeros – at the beginning and at the end of the cycle of ontogenesis.
The ontogenesis of birch leaves in a clean ecological environment from the beginning of simultaneous budding to the fall of each accounting leaf takes place according to the regularity

where y – dependent indicator, that is, one of the measured
parameters of the sheet (length, width, perimeter, area);
t – vegetation time from the beginning of ontogenesis – from
the moment of simultaneous budding – to the fall of each birch leaf,
day;
a1ta2EXP(−a3ta4 – biotechnical law in the full form of the dynamics of leaf parameters in plant ontogenesis (in the cycle of the growing season from budding of all leaves to the fall of each of the accounting birch leaves),
− a5ta4 – negative influence (braking due to a negative sign with acceleration starting from zero) of climatic seasonal cycles (and less air environment in the vicinity of birch leaf groups) on the development and growth of accounting leaves according to the law of exponential growth, 1 6 a ...a – the parameters of the model (3), the specific numerical values of which are obtained during the identification of a pattern in a CurveExpert-1.40 software environment based on measurements of four parameters of accounting leaves.
According to Table 1, regularities were obtained (Figure 5):

dynamics of the ontogenesis of the length of birch leaves

dynamics of ontogenesis of the width of accounting leaves

- dynamics of ontogenesis of the perimeter of accounting leaves

The graphs show that the correlation coefficient for the four parameters of the 20 accounting leaves is more than 0.95. All four patterns belong to the group of the strongest factor relationships. It can be seen from the graphs of deterministic models that groups of points have a wave change relative to the linear trend.
Computational experiments have shown that the results of the experiment according to the data in Table 1 are wave-influenced by external (exogenous) factors (azimuth, height, radius and angle of abutment). Because of them, the internal (endogenous) biological parameters of 20 accounting leaves (the period of ontogenesis, length, width, perimeter and leaf area) change greatly. Biological parameters have a strong oscillatory adaptation in each accounting leaf of birch.
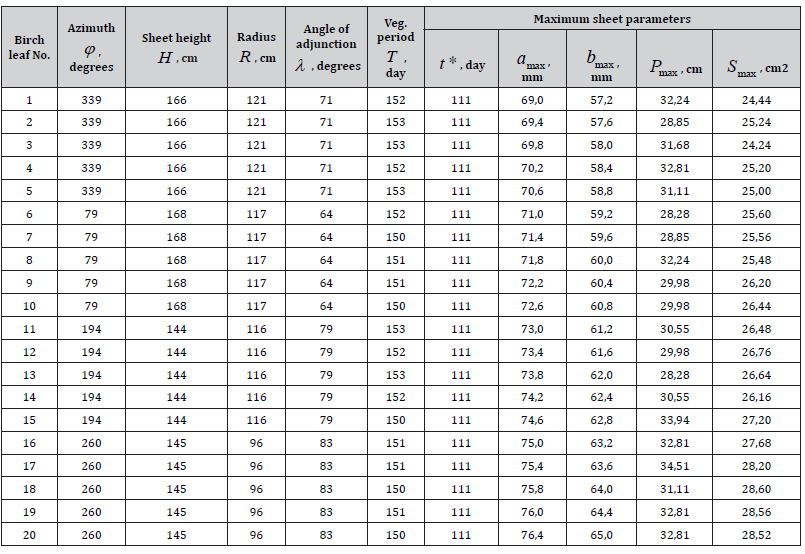
Table 2 shows the maximum values of five parameters for each birch accounting sheet. The maximum values of all parameters of the accounting leaves of pure young birch appeared on August 21, 111 days after the beginning of the growing season – on May 2 after budding.
Table 2:Initial data of maximum parameters of pure birch leaves.
If phenological measurements were carried out daily, then, depending on external factors, they would receive not 111 days, but different values for the main indicator – the growing season at the maximum of development and growth.
Rating of accounting leaves by rank
Any factors have a clear vector orientation. For example, anyone
understands the direction of quantitative changes in agriculture;
everyone strives for the best in life. Therefore, there are only
two possible options for the behavior vector (and this applies to all
living things):
a) less is better (yes, better, the symbol for the vector is “better
→ is worse”).
b) it is better to have more (and this is good for the vital activity
of birch leaves, therefore in table 3 the symbol ↑ ).
In function =RANK(T1;T$1:T$20;0) in the Excel software environment,
the following conventions are used for the first indicator
in the Excel software environment:
T1 – is the identifier of the ranked column and the first row;
T$1 – the first row of the ranked column;
T$20 – the last row of the ranked column according to Table 1; 0
1 – ranking in descending (0) or ascending (1) (Figure 3).
Table 3:Rank distributions of parameters of accounting leaves of pure birch
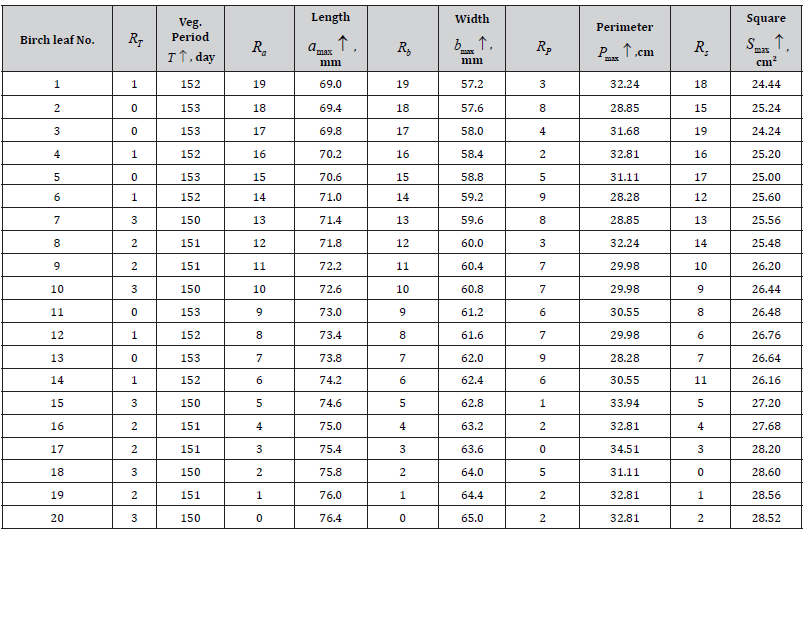
The ranks vary from zero, so you will have to subtract one from the ranking results in the Excel software environment (ranking by places).
The behavior vector of all four parameters of the sheet is “better than more”, so the code 0 is used in descending ranking.
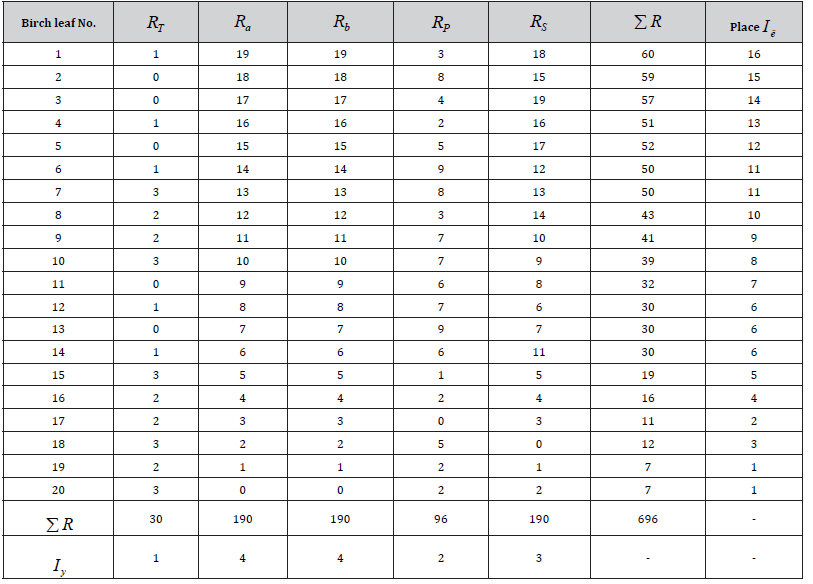
According to Table 4, the accounting leaves No. 19 and No1. 20 were the best from an ecological point of view. They took the first place in the rating of birch leaves.
Table 4:Rank distributions of parameters of accounting leaves of young birch
The relationship of the factor from itself is determined by the rank distribution. It shows the quality of the initial data and serves to check their reliability and quality by the correlation coefficient of the identified distribution equations y = f (R = 0,1,2,3,...) .
Ranks are convenient to use instead of factors, since they remove
the mathematical problem of the “curse of dimension”, for
example, when rating influencing and dependent indicators. The
influence of dimensionality is excluded.
Thus, factor analysis is carried out in four stages:
1) identification of rank distribution patterns;
2) rating of rows and columns of the matrix according to table
2;
3) identification of patterns of binary relations;
4) rating of binary relations by correlation coefficient (indicator
of tightness of connection).
Rank distributions
The vector of the preference preorder “better worse” is the same for all five factors: the more, the better.
According to the five parameters of the accounting leaves (Table. 1) the equations of rank distributions were obtained (Figure 6);

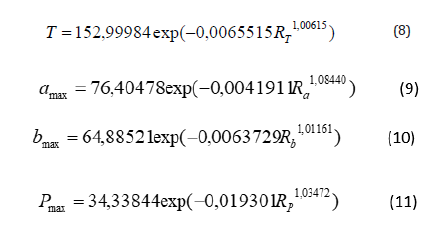

According to the deterioration of the quality of measurements
(decrease in the correlation coefficient), the parameters of the accounting
leaves are arranged in the order:
1) 1.0000 – the growing season, T day;
2) 0.9999 – the length of the accounting sheet amax , mm;
3) 0.9999 – the width of the accounting sheet bmax , mm;
4) 0.9941 – the perimeter of the accounting sheet Pmax , cm;
5) 0.9890 – the area of the accounting sheet Smax , cm2.
The vegetation period of the accounting leaves is measured most accurately in birch trees growing in clean environmental conditions, and the area of accounting leaves is determined with the greatest error. The adequacy of rank distributions is higher than the adequacy level of 0.95.
This indicates the high quality of measurements and the successful adaptability of birch leaves to the external environment in clean conditions.
Rating of factors by rank
Without statistical modeling, it is possible to identify the significance of each of the five factors. To do this, we take only the ranks of the parameters from the data in Table 1 (Table 3).
By summing the ranks in five columns, we determine the sum of the ranks ΣR and, according to the growth of this amount, we place places in the rating of the accounting leaves. Accounting sheets No. 19 and No. 20 are in the first place, and accounting sheet No. 1 is in the last 16th place (Table 4).
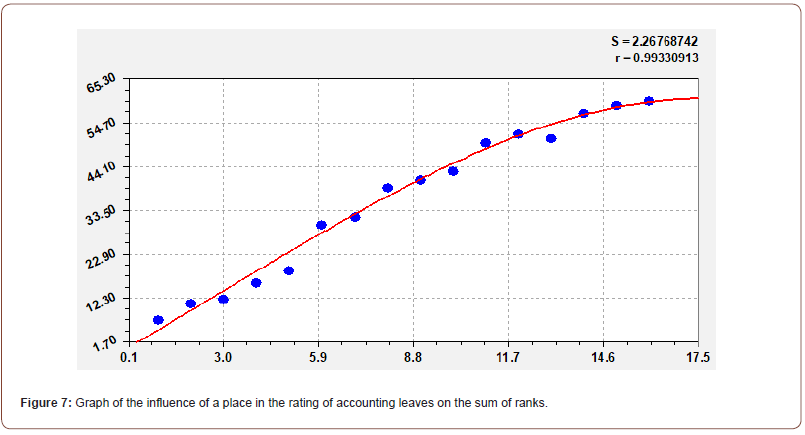
The sum of the ranks from the place in the rating (Figure 7) of the accounting leaves of a birch growing in eco-logically clean conditions is distributed according to the formula

Next, we summarize the data on all 20 lines and get a rating of factors. As an indicator, the vegetation period was in the first place. This indicator is very simple to measure: it is necessary to note the accounting leaves in the local areas of the crown of the tree in phenological observations and record the beginning of budding and the end of the growing season at the time of the fall of each accounting sheet.
According to the distribution of ranks, and without statistical modeling, it is possible to conduct research in schools.
With a correlation coefficient of 0.9933, the rating of accounting leaves according to Table 4 is distributed according to the formula of the biotechnical law. Then there will be some kind of maximum in the rating, which theoretically requires reflection, because the rating, as a rule, obeys the law of exponential growth. But this is the task of further research.
Influence of external factors on the sum of ranks
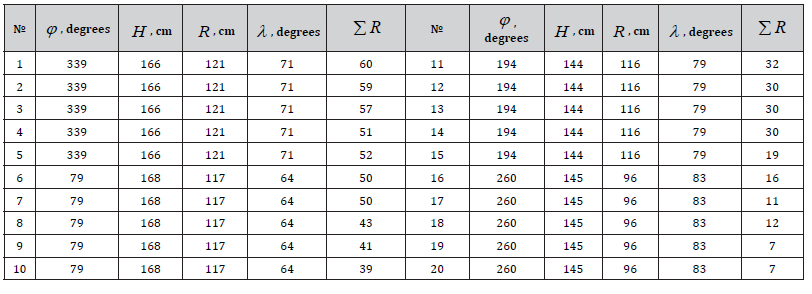
Table 5 shows the external factors and the sum of the ranks for the five internal factors. According to factor relations, formulas are obtained (Figure 8):
Table 5:Rank distributions of parameters of accounting leaves of young birch
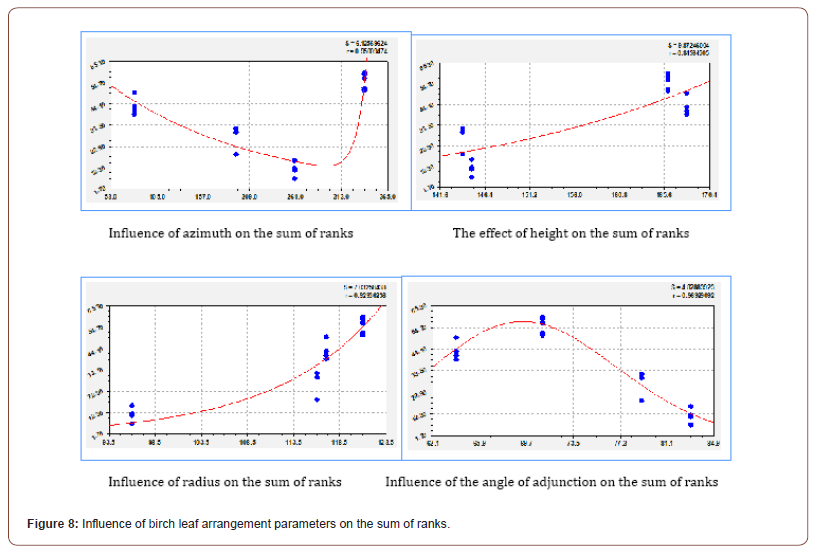
the influence of the azimuth of the location of the birch branch on the sum of ranks

the influence of the height of the leaf above the soil surface on the sum of the ranks

the influence of the angle of the branch junction on the sum of the ranks of the five parameters:

The correlation coefficients are, respectively, 0.9501; 0.8459; 0.9294 and 0.9693. Therefore, according to Table 5, there is some pattern in the rating of five internal factors in the vital activity of accounting leaves.
the influence of the radius of leaves on one branch of a birch tree on the sum of ranks:

It can be considered proven that the influence of four exogenous factors on a complex indicator in the form of the sum of the ranks of five endogenous factors is significant.
Rating of factors by trends
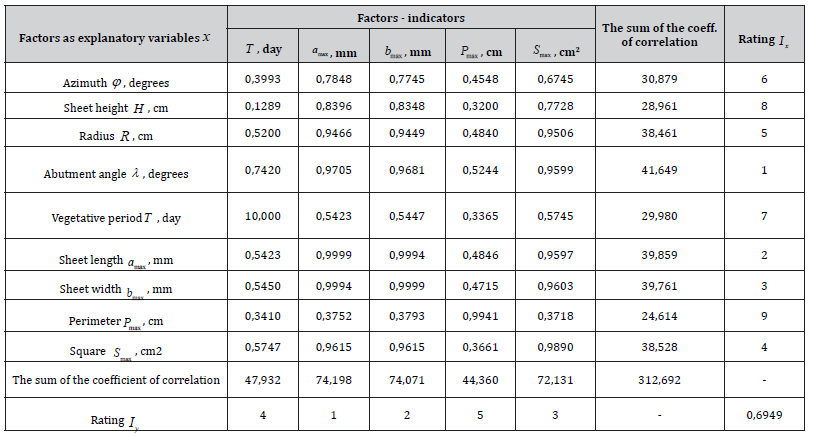
Table 6 shows the correlation coefficients of regularities for all rank and binary distributions according to the formula (3).
According to Table 6, the coefficient of correlative variation is 31,2692 / (9 5) = 0,6949. This value is a fairly high indicator of the functional connectivity of individual elements of the leaves - branches - soil system, located in environmentally friendly conditions, with the use of deterministic patterns.
Table 6:Correlation matrix and rating of factors by deterministic models
The coefficient of correlative variation is used when comparing different objects of study, in this case, the structure of the crown and foliage of birch trees in different ecological growing conditions. At the same time, the type of the system under study does not affect the specified verification criterion, and the correlative variation depends entirely on the internal properties of the system under study.
According to the rating, among the influencing variables, the angle of the branch to the birch trunk was in the first place, the length of the leaf was in the second place, and the width of the leaf was in the third place.
As an indicator, the length of the leaf is in the first place, the width of the leaf is in the second place and the area of the birch accounting sheet is in the third place. In this regard, it is quite possible to abandon such a difficult indicator in measurements – the area of the sheet – in further studies. The angle of abutment, although it occupies the first place as an influencing variable, is not a dependent factor. Therefore, it can also be excluded.
Correlation matrix of trends of binary relations
Let’s consider, without rows and columns of rating indicators from Table 6, only the correlation coefficients of biotechnical patterns of binary relations (Table 7). Diagonal cells with the adequacy of rank distributions are also excluded.
Table 7:Correlation matrix for deterministic models in the form of trends
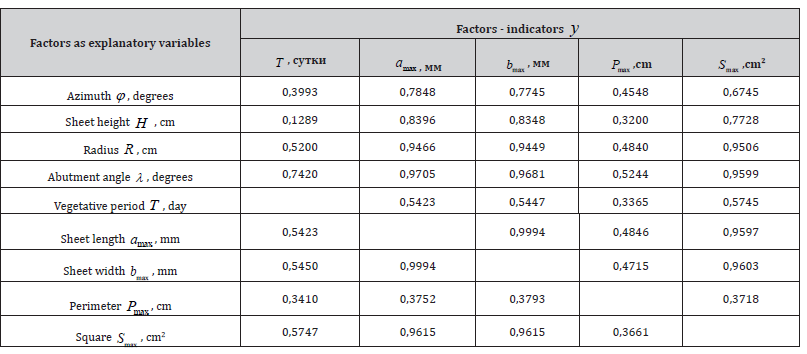
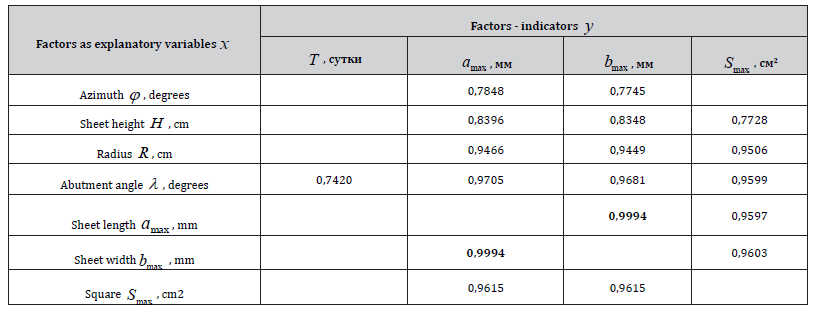
Only 40 binary relationships remain. From them, you can choose patterns with an acceptable level of adequacy. There are strong patterns with a correlation coefficient r ≥ 0,7 (Table 8).
18 equations were selected that have a close relationship by a correlation coefficient of more than 0.7, that is, by the level of adequacy, belonging to the group of strong factor relationships. Therefore, they can be used to compile a set of equations for a simulation model of the deterministic behavior of birch leaves growing in environmentally friendly conditions, with maximum growth and development during the growing season according to five biological parameters.
It is also noticeable that the angle of the branch to the trunk of the birch has strong influences on four biological parameters of the leaves out of five. This fact allows us to outline further studies on the influence of the angles of abutment in many birch trees.
It can be seen from the data in Table 8 that one column and two rows with the parameters of the accounting birch leaves were excluded.
Table 8:Correlation matrix for strong binary bonds at r ≥ 0,7
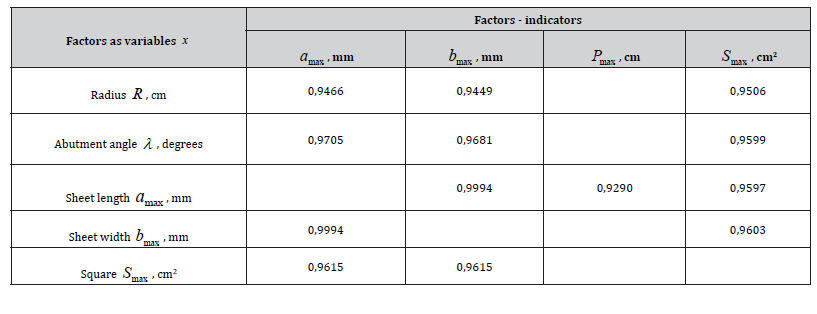
Next, we will increase the requirement for an acceptable level of adequacy for the correlation coefficient to 0.9 (Table 9). In this table, out of 12 models, 10 equations (25% of the total number of 40 trends) are above the permissible correlation level of 0.95.
Table 9:Correlation matrix for r ≥ 0,9

The maximum correlation coefficient of 0.9994 is observed for the functions amax = f (bmax) and bmax = f (amax). It turns out that the length and width of the leaf are mutually reversible parameters of accounting birch leaves growing in environmentally friendly conditions. This fact can only be used in further experiments by one of them.
Measuring the width of birch leaves is preferable because this parameter is located in the first half of the leaf length near the petiole. And in the second half, along the length of the leaf, strong shape changes occur (lateral deviation of the tip of the birch leaf, twisting along the main vein, etc.). In this regard, in further experiments, we recommend measuring only one parameter – the width of a birch leaf. In addition, it turned out to be practically convenient to photograph a birch leaf for subsequent measurement in width.
Next, we present the results of statistical modeling based on patterns with additional wave components.
Wavelet signals of binary relations
The physico-mathematical approach assumes an understanding of the dynamic series over the growing season as a reflection of some composite process of vital activity of the accounting leaves or a set of sequentially and parallel occurring natural and/or natural- anthropogenic processes.
Table 10 shows the correlation coefficients of the asymmetric wavelet formula and the rating by their sums for relations with wave components.
Note: Factor relationships are highlighted in bold, except for the trend containing wave components.
Table 10:Correlation matrix and factor rating for models with wave terms.
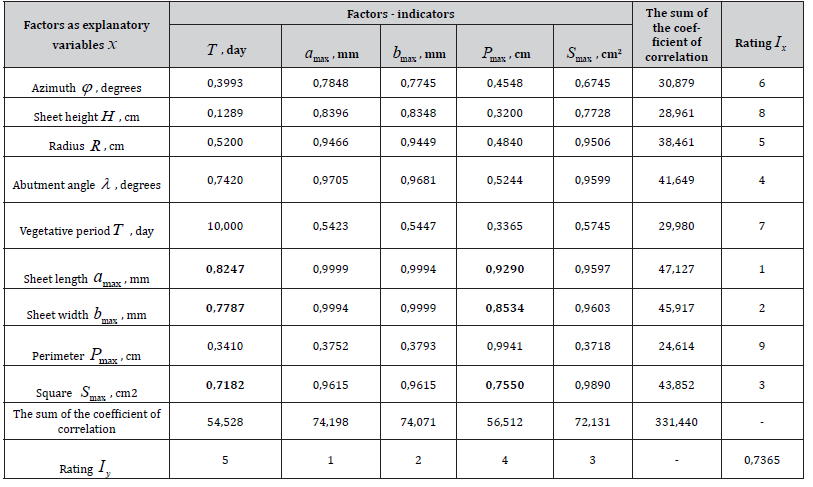
The coefficient of correlative variation is 33.1440 / 45 = 0.7365. This is a high indicator of the functional connectivity of the leaves - branches– soil system with trends with wave patterns. Moreover, it turned out that only the leaves themselves have oscillatory adaptation according to three biological parameters – the length, width and area of the birch accounting sheet.
According to the rating of Table 10 (Figure 9), among the influencing variables, the length was in the first place, the width was in the second, and the area of the birch accounting sheet was in the third.
The angle of abutment took only the fourth place. As an indicator, the length is again in the first place, the width is in the second, and the area of the birch accounting sheet is in the third place according to models with wave components, which, according to Table 10.
The rating of influencing variables (Figure 9) is determined by the formula according to our modified Mandelbrot law

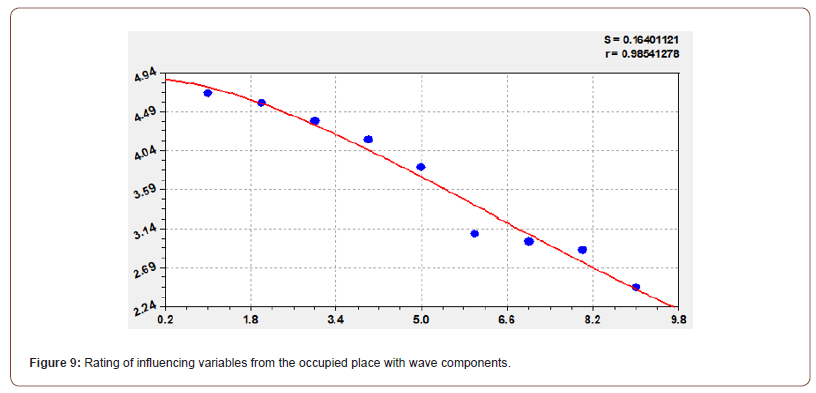
where Σr –the sum of the correlation coefficients according to Table 10, and for all five columns, Ix are places in the rating as influencing factors.
From the graph in Figure 9, it can be seen that the points near the curve are located with some fluctuation. To study the vibrational adaptation of birch in environmentally friendly conditions for a large number of influencing variables, new experiments need to be carried out.
Correlation matrix involving fluctuations
Accounting for fluctuations requires identification of the asymmetric wavelet formula based on the residuals from trends.
The correlation matrix with the participation of fluctuations is shown in Table 11, which is obtained by excluding from Table 10 two columns and two rows of the rating of factors as influencing variables and at the same time as dependent indicators.
Table 11:Correlation matrix for trends and wave models at r ≥ 0,7
The number of models with an adequacy of at least 0.7 turned out to be 24 (more than half of 40) instead of 18 according to deterministic equations (trends).
At the same time, all columns were preserved, but two rows were excluded.
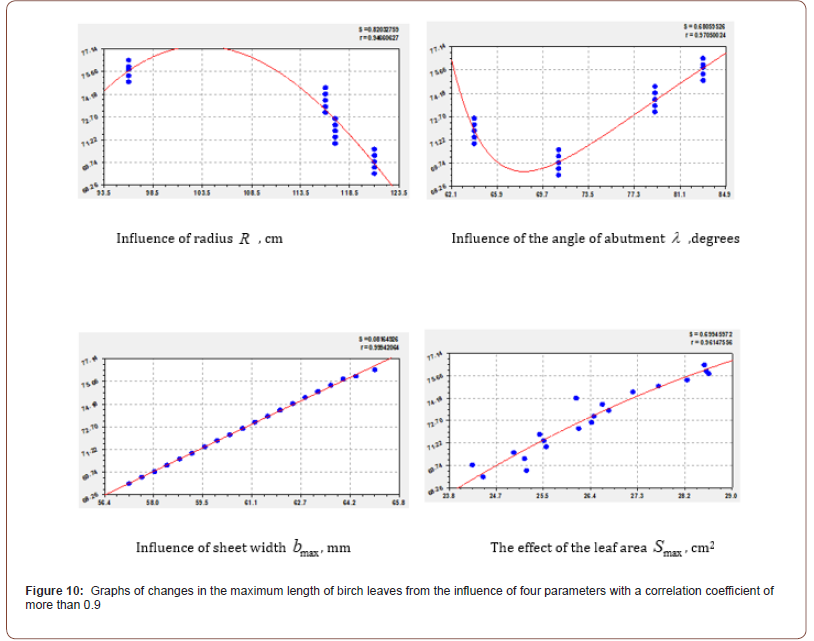
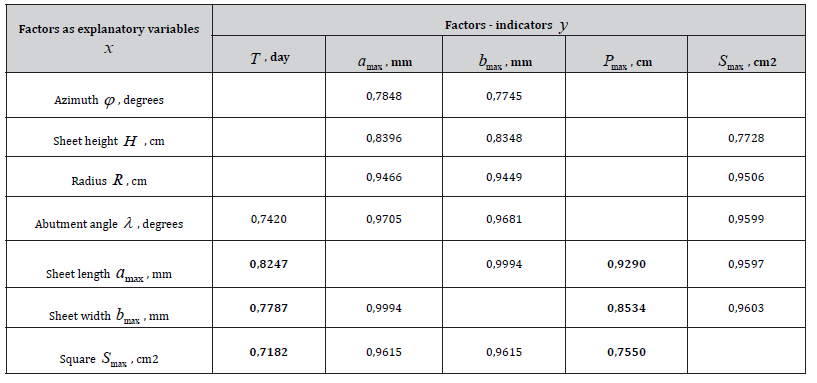
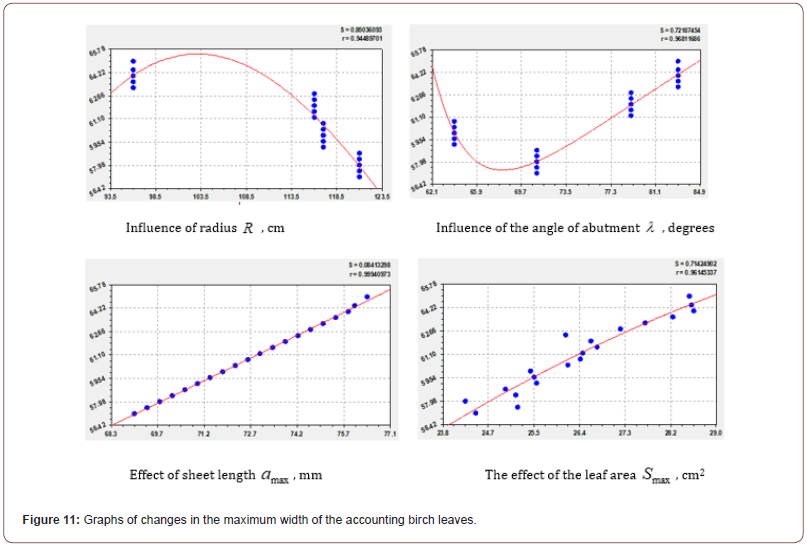
Next, we will tighten the requirements for acceptable adequacy to the level of 0.9 (Table 12). As a result, there are 13 strong equations, of which three groups of four indicators can be distinguished (Table 12, Figure 10-12) only by trends (except for the effect of the leaf length on the perimeter along the wavy edges.
Table 12:Correlation matrix for r ≥ 0,9

The perimeter has received a high adequacy only taking into account the wave components (in the tables it is highlighted in bold), so we consider it separately in the future according to the properties of the formation of the margins of the birch leaf.
The period of ontogenesis was excluded from binary relations as an indicator (there are few points and it needs to be measured in one day), and four parameters (azimuth, height, vegetation period and perimeter of accounting leaves) were excluded as influencing variables.
Table 13 shows the trend parameters that have strong factor relationships with a correlation coefficient greater than 0.9 when changing amax , bmax and Smax .
Table 13:Parameters of trends in the behavior of accounting leaves of pure birch

The mutual influence of the length and width of the leaf receives an almost straight line, that is, proportionality is observed between these two linear parameters of the birch accounting sheet. As a result, they become mutually replaceable.
It can also be seen from the graphs that the optimal angle of abutment is in the range of 68-70о. At the same time, this parameter has two components, all the others have only one component.
From the data in Table 13, it is also clear that the number of model parameters for the area of the birch leaf is much smaller in number compared to the length and width.
The effect of the length and width of the accounting leaves on other parameters is characterized by a simple exponential law. The mutual binary relations between the maxima of length and width have the greatest closeness of the factor relationship with a correlation coefficient of 0.9994.
The impact of the requirements for the adequacy of the regularity
Regularities can be estimated if the values of the correlation coefficient of all binary relations are distributed on an interval scale (for example, through one tenth) of the permissible level of adequacy by the correlation coefficient.
The result of such a distribution for the influence on the correlation matrix (Table 10) is given in Table 14.
Table 14:Characteristics of the sample by levels of adequacy
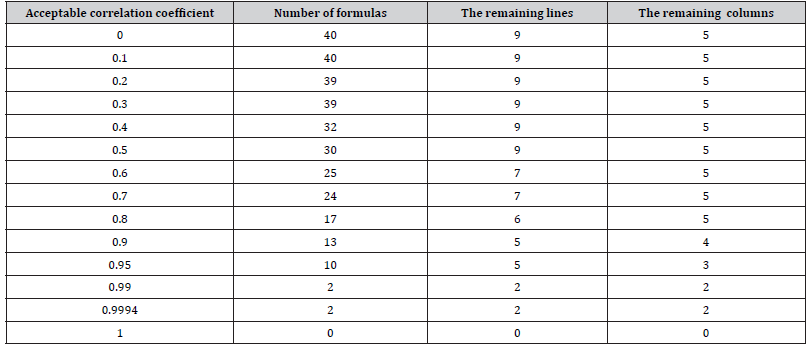
The permissible correlation coefficient shows the right boundary of the interval scale of adequacy under the condition “not less than” or ≥ in relation to a certain value.
By setting an acceptable value[r], it is possible to estimate the level of reliability of the study required in factor analysis.
The zero correlation coefficient is formed when calculating the arithmetic mean for all values of the indicator
The number of binary relations will be 9 × 5 – 5 = 40 pcs. In this case, many conduct a superficial analysis, since the arithmetic mean value of the studied factor does not sufficiently reflect the behavior of many accounting leaves in ecologically clean birch growing conditions.
Table 14 also shows the regularities of the dynamics of the requirements for the adequacy of the measurements carried out, and according to the four parameters of the leaves and the period of their ontogenesis, that is, to assess the behavior of the accounting birch leaves.
After identification, the following formulas are obtained:
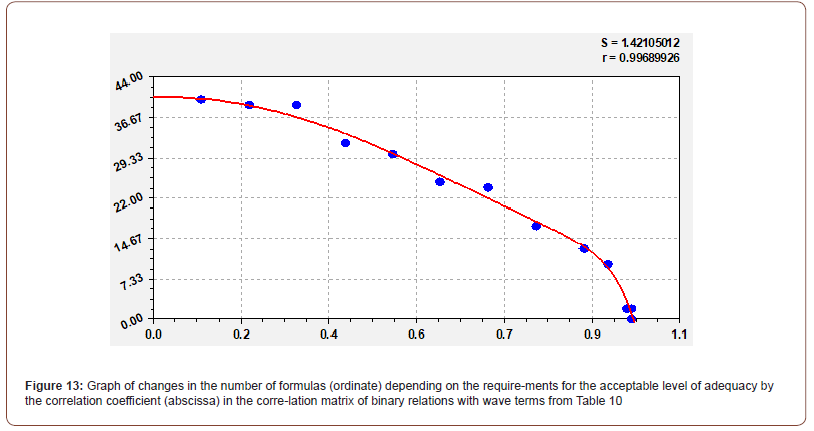
- the number of formulas (Figure 13) of the correlation matrix
from the acceptable level of adequacy according to the correlation
coefficient

the number of columns in the correlation matrix (figure 14)

From the data in Table 14 and the graphs in Figure 14, it can be seen that a decrease in the number of rows of the correlation matrix begins under the condition R ≥ 0,5 or [R]= 0,5 , a decrease in the number of columns – from the level [R]= 0,8 . Therefore, all five indicators in the dynamics of adequacy have a level of at least 0.8. At the maximum level of adequacy of 0.9994 there are two parameters – the length max a and width max b of the accounting leaves.
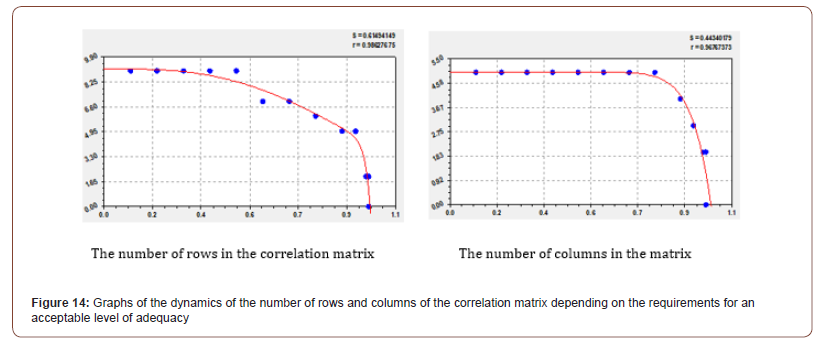
In the future, accounting birch leaves in environmentally friendly conditions can be studied by two parameters – the length and width of the leaves, which reach the maximum of development and growth during the optimal growing season t * . To do this, it is enough to measure the parameters of birch leaves in some incomplete interval, including the expected optimal value of the time to achieve maximum growth and development.
As a rule, with a sufficient number of non-averaged observations, the maximum permissible correlation coefficient equal to one is not achieved. Usually, the CurveExpert-1.40 software environment automatically outputs in the upper right corner with r =1 a small number of observations. To avoid this, it is necessary to launch all observations into the identification process, and without any grouping (averaging).
Next, let’s consider the wave components according to the asymmetric wavelet formula, which were marked in bold in Table 10. This fragment of the correlation matrix is given in Table 15.

For the first time, it was possible to obtain models of many types of behavior dynamics series based on the concept of additive decomposition of any dynamic series into a set of wavelet signals.
Three parameters of the sheet (length, width and area) remained as influencing variables. All of them, due to the oscillatory adaptation of the accounting leaves to the growing conditions, received strong factorial relationships with a correlation coefficient of more than 0.7.
The remaining two dependent factors (vegetation period and maximum perimeter) became dependent indicators. As a result, three of the five factors became influencing, and the remaining two became dependent. The greatest correlation coefficient of 0.9290 was the effect of length on the perimeter of a birch leaf, and the smallest was the effect of area on the growing season of 20 accounting birch leaves.
The maximum length of the registered birch leaves has the greatest influence on the duration of the growing season with a correlation coefficient of 0.8247. Next, we consider a complete wavelet analysis before the formation of indivisible residues.
The effect of the maximum length on the growing season
The influence of the maximum length of the accounting leaves on the change in the growing season (Figure 15) is characterized by a general statistical model that includes 16 components (Table 16), each of which represents a quantum of behavior.
Table 15:Models with wave terms

Table 16:Parameters of 16 wavelet signals of the behavior of birch accounting leaves under the influence of the maximum length of the accounting sheet on the growing season
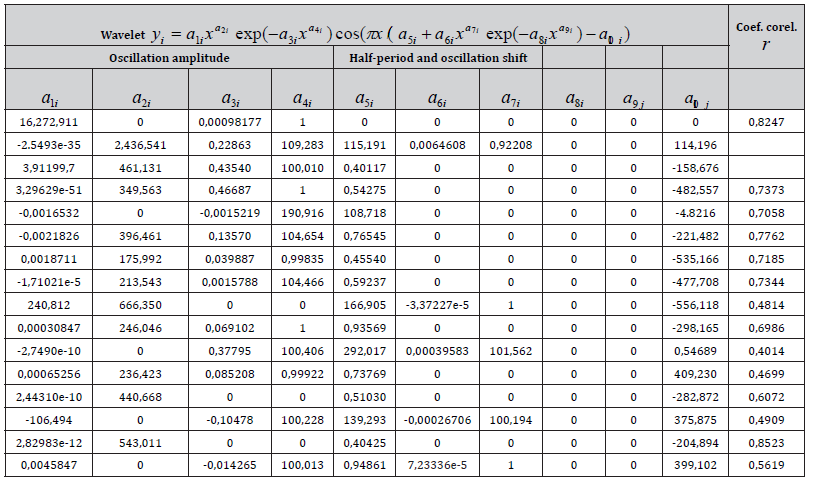
According to the capabilities of the CurveExpert-1.40 software environment, a three-term model with a total correlation coefficient of 0.8247 was obtained. The remaining components were identified separately.
Then the fourth term was obtained from the remainder of this formula, and then the fifth term was obtained again from the next remainder, etc. The remnants after the 15th oscillation (with the trend of the 16th component) turned out to be less than the measurement error of 0.05 mm. In this case, the measurement error is calculated as half of the division price of 0.1 mm (Table 1).
Thus, in all the examples of wavelet analysis, the identification of new components in the form of asymmetric oscillations was carried out completely until the measurement error was reached by the residuals. In this case, the error of modeling by identifying wavelet signals becomes comparable to the measurement error.
The identification of all possible wave components, provided that the measurement error is reached, is called a complete wavelet analysis. It is possible only with a high quality of the initial statistical sample. Therefore, a complete statistical model in the form of a sum of wavelet signals characterizes the high quality of quantitative results in carefully performed field experiments.
Similar procedures were performed for other factor relations from Table 15. Then it turns out that there is a fundamental relationship between the period of ontogenesis and the parameters of any birch leaf. At the same time, depending on the external conditions, the maximum values of length, width and area receive different intervals of change. Therefore, in further studies, it is also necessary to measure the parameters of air, water and soil. This will make it possible in the future to decipher the vital processes of the vegetative organs of annual, and then perennial, plants.
Conclusion
According to the distribution of ranks, it is possible to conduct
research in schools.
2. Factor analysis is carried out in four stages: identification of
patterns of rank distribution; rating of rows and columns of the matrix
of experimental data; identification of patterns of binary relations;
rating of binary relations by correlation coefficient.
By reducing the correlation coefficient of the rank distribution
equations , the parameters of the accounting leaves are arranged in
the order: 1) 1.0000 – the growing season T , day; 2) 0.9999 – the
length of the accounting sheet amax , mm; 3) 0.9999 – the width of
the accounting sheet bmax , mm; 4) 0.9941 – the perimeter of the
accounting sheet Pmax , cm; 5) 0.9890 – the area of the accounting
sheet S max, cm2.The vegetation period of the accounting leaves of
the birch is measured most accurately, and the area of the accounting
leaves is determined with the greatest error.
3. The rating of factors by rows and columns showed that the
vegetation period was in the first place as an indicator. This indicator
is easy to measure: it is necessary in phenological observations
to mark the accounting leaves in the local areas of the crown of the
tree and record the beginning of budding and the moment of falling
of each accounting birch leaf.
According to the rating trends among the influencing variables, the angle of the branch to the trunk of the birch was in the first place, the length of the leaf was in the second place, and the width of the leaf was in the third place. As a dependent indicator, the length is in the first place, the width is in the second, and the area of the birch accounting sheet is in the third. With waves according to the rating of influencing variables, the length was in the first place, the width was in the second, and the area of the accounting sheet was in the third. Taking into account the wavelets, the angle of abutment took only the fourth place. As an indicator, the length is again in the first place, the width is in the second, and the area of the birch accounting sheet is in the third place according to models with wave components, which appeared only in three biological parameters – the length, width and area of the birch accounting leaves.
4. The coefficient of correlative variation of factor analysis is 0.6949. This is a fairly high indicator of the functional connectivity of individual elements of the leaves – branches – trunk – soil system, located in environmentally friendly conditions.
Taking into account the wave components, the coefficient of correlative variation is 0.7365, that is, wave patterns in the parameters of birch leaves have increased the level of adequacy from an average (0.5-0.7) to a strong (0.7-0.9) level. This fact proves that the vibrational adaptation of birch leaves in the period of ontogenesis is a significant biological process.
5. Out of a total of 40 regularities, 18 equations (45%) were selected, having a close relationship by a correlation coefficient of more than 0.7, that is, by the level of adequacy, belonging to the group of strong factor relationships with maximum growth and development during the growing season according to five biological parameters of birch leaves.
The maximum correlation coefficient of 0.9994 is observed for the functions amax=f(bmax) b and bmax=f(amax) . It turns out that the length and width are mutually identical parameters of accounting birch leaves growing in environmentally friendly conditions. The optimal angle of the branch to the trunk is in the range of 68- 70о.
The influence of the length and width of the accounting leaves on other parameters is characterized by a simple exponential law in the form of a power function.
6. Above a strong level of adequacy with a correlation coefficient of at least 0.9, 13 (or 32.5%) equations remain, of which three groups of four indicators can be distinguished only by trends. The perimeter received high adequacy only taking into account the wave components. The period of ontogenesis was excluded from binary relations as an indicator, and four parameters (azimuth, height, vegetation period and perimeter of birch leaves) were excluded as influencing variables.
Acknowledgement
None.
Conflict of Interest
None.
References
- Worknov T A (1995) History of phytocenology: study. posob. M. Argus pp. 158.
- Stages of plant ontogenesis.
- Uranov AA (1975) Age spectrum of phytocenopopulations as a function of time of energy wave processes. Biological Sciences 2: 7-34.
- Galibroda R. The size of the leaves of trees obeys the laws of physics.
- Mazurkin PM (2023) Symmetry of a Set of Leaves in The Average and Asymmetry of Each Leaf of a Birch (Betula Pendula) In the Dynamics of Ontogenesis. AnnalBiostat& Biomed Appli 5(3): 1-17.
- Mazurkin PM (2014) Identification of the wave patterns of behavior // 14th International multidisciplinary scientific geoconferenct & SGEM2014. GeoConferencejn NANO, BIO AND GREEN – TECHNOLOGIES FOR A SUSTAINABLE FUTURE. Conference proceedincs. Volume 1. Section Advances in Biotechnology. Albena, Bulgaria pp. 373-380.
- Mazurkin PM (2014) Method of identification // 14th International multidisciplinary scientific geoconferenct & SGEM2014. GeoConferencejn NANO, BIO AND GREEN – TECHNOLOGIES FOR A SUSTAINABLE FUTURE. Conference proceedincs. Volume 1. Section Advances in Biotechnology. Albena, Bulgaria pp. 427-434.
-
P M Mazurkin*, A I Kudryashova. Analysis of the Dynamics of Ontogenesis of Birch Leaves (Betula Pendula) Under Environmentally Friendly Conditions. Annal Biostat & Biomed Appli. 5(3): 2023. ABBA.MS.ID.000615..
Birch, Leaves, Parameters, Ontogeny, Dynamics, Ratings, Patterns, Phytocenoses, Biological parameters
-

This work is licensed under a Creative Commons Attribution-NonCommercial 4.0 International License.


